Ivane Javakhishvili Tbilisi State University
Paata Gugushvili Institute of Economics International Scientific
INSIGHTS INTO ECONOMIC DEVELOPMENT PECULIARITIES OF DIFFERENTLY DEVELOPED COUNTRIES: A CASE STUDY OF LITHUANIA AND NORWAY[1]
Abstract. The paper tackles comparison issues of differently developed countries. Conventionally, countries with certain indicated similarities, e.g. level of development, size, resource endowment or other, are being juxtaposed. We raise a task to measure selected aspects of two differently developed countries, specifically Lithuania and Norway. The countries are considered representatives of the Baltic States and Nordic countries. The aim of such comparison is two-fold: the first, to show the complexity of such comparison, and the second, to introduce to a broader audience a project - The Economic Integration of the Nordic-Baltic Region Through Labour, Innovation, Investments and Trade (LIFT), Project contract with the Research Council of Lithuania (LMT) No is S-BMT-21-7 (LT08-2-LMT-K-01-070), Iceland, Liechtenstein and Norway grants https://eeagrants.org/, which is recently under implementation. The formulated insights will trigger the launch of new similar projects, facilitating the cooperation of differently developed countries and leading to mutual benefits.
Introduction
The presented paper compares differently developed economies: Lithuania and Norway. It is unanimously agreed that comparisons are usually made by similarly developed countries or countries with common features, e.g. history, culture, price level, similar consumption patterns or some other shared denominator. In our case, we will compare two countries that do not share listed features and are regulated by specific legislation. A natural question may arise of why such comparison may be needed, especially considering known differences in the price level, level of remuneration of the labour force, and rather remoted GDP per capita. The reason behind such a choice of countries is the project we currently implement (it is indicated in the abstract); another reason is to illustrate how challenging such evaluation is and how biases of researchers can alter results.
Anyway, it is crucial to be well acquainted with the research object for any research. The suggestion may seem rather trivial; alas, as practice shows, numerous analyses are made without properly immersing into specifics of objects under consideration and, therefore, providing rather superficial conclusions.
A description of the project, which is already mentioned several times, is provided here. The project coordinator is Vilnius Gediminas Technical University (VILNIUS TECH), Lithuania. The essence of the project is to find out what benefits for both sides, i.e. the Baltic States, namely Lithuania, Latvia, and Estonia, representing one side, and Norway, representing Nordic countries, could be revealed. The project has four work packages, which tackle specific forms of cooperation: labour movement, capital movement, specifically FDI, knowledge or technology transfer, conditioned by spillovers in companies containing capital from both sides and trade. The project's authors, the four participating scientific organizations from Lithuania, Latvia, Estonia and Norway, claim that "first, the project's results will help us determine the causes and consequences of migration for the growth or changes in economic sectors and the economy's structure. In addition, the detailed analysis of emigration problems and the obtained results will allow for forming a re-emigration policy, preparing the integration of measures for emigrants returning to society, and developing measures to stop emigration. Secondly, the analysis of successful examples of innovation and technology transfer from the Nordic countries to the Baltic countries and their impact on the creation of new businesses, new products or services will help to form a targeted innovation and technology transfer policy to select measures to implement it and to prepare an attractive innovation- and knowledge-receptive infrastructure. Third, developing foreign capital companies creates jobs transfer technologies and good practices. Therefore, the analysis will reveal the most attractive business branches for foreign investors. At the same time, policy guidelines will be prepared to attract foreign capital companies to the targeted business sectors that would create high-added value. Fourth, the analysis of international trade volumes will determine the most popular goods and services, product groups, and brands of the Baltic countries in the Northern European countries and vice versa. The result of this analysis will prepare recommendations for the Chamber of Commerce to develop international economic relations with Northern European countries in the most promising business sector. Therefore, connecting the abovementioned research will reveal the effects of regional integration through the movement of people, knowledge, capital and goods. The results of the conducted research will be significant in preparing the guidelines for the further development of international economic relations between the Baltic countries and Northern European countries so that the Baltic countries (including Lithuania) would gain greater economic, social and technological benefits. In addition, the close cooperation between Norwegian and Baltic researchers improves the quality of research and studies” (LIFT https://sisu.ut.ee/lift/bendra-informacija?lang=et ).
Recently the following project papers were published on wage compensation peculiarities (Laurimäe et al., 2022); virtual coworking in Estonia and Norway (Sinitsyina et al., 2022); gender disparities in comparison to other countries (Tverdostup & Paas,2022); spatial interaction of employment (Kivi & Paas,2021); crossboarder cooperation in Estonia and Finaland (Tverdostup et al., 2022); technology transfer causes and implications Burinskas et al. (2021); Šimelytė et al. (2021), state of technology transfer (Lapinskiene et al., 2023).
The task of the project proposal still remains challenging since myriad factors impact companies' performance, which ultimately conditions the performance of a whole country. Those factors are demand for the product offered, ability to compete with rivals, occupied market nich, pricing, availability of required workforce, quality and motivation, financial capability of customers, etc.
In this paper, we aim to find some hints to the raised questions by comparing two selected countries belonging to the Baltic States and Nordic countries. Since the economic conditions of all countries belonging to the indicated blocks are similar, the comparison would allow us to reveal partly consistent patterns of the countries' development, their similarities and differences. Understanding differences would allow all cooperating parties to reach more fruitful cooperation results.
Methodology
A relatively broad set of indicators allows the comparison of different facets of development. Since integrating various aspects is a typical economic issue, a significant strand of literature is devoted to similar problems (Baltgailis, 2019).
The discussion will not end in the observable future. The authors argue what aspects could be measured, what sets of indicators could be selected, how the chosen indicators could be integrated into complex indicators or indexes, what methods were used, and how benchmarks may be selected.
In this case, we chose a different methodology. Knowing that Norway performs much better (not slightly, alas, measuring in times) than Lithuania, we started searching for indicators, allowing us to find out facets where Norway nears Lithuania or even slightly lags. We admit that such an approach is biased and has obvious limitations. Anyway, let us experiment for the sake of pure economic curiosity.
Comparative analysis of selected indicators
Let us start our comparison journey by basing information about the examined countries.
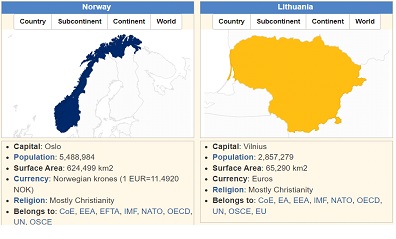
Figure 1. Main data characterizing selected countries
Source: https://countryeconomy.com
For comparison in this paper, we will use two primary sources. One is the portal https://countryeconomy.com, which, as it indicates, collects data from the Ministry of Finance, Central Bank, National Statistics Offices, World Bank, the International Monetary Fund, etc. This source is open and, as the author found out, is very convenient. Another source we will use later in this paper will be the database Passport, provided by Euromonitor International. This database is not accessible openly; an institutional subscription is needed. Since Vilnius Gediminas Technical University subscribes to this important database, we can check both countries' forecasted development trends.
Let us return now to the comparison of the selected countries. As reflected in Figure 1, Norway has an almost ten times bigger surface area and almost twice larger population; in both countries, Christianity prevails. Let us glance at the level of development reached by the considered states. The classical indicator for measuring economic development is GDP per capita. Data characterizing the development of both countries is provided in Figure 2 below.
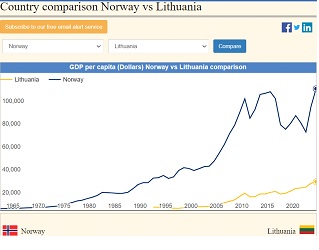
Figure 2. GDP per capita in selected countries
Source: https://countryeconomy.com
Note: GDP per capita in Norway in the year 2022 was $106,328, while in Lituania in the same year it reached just $25,036https://countryeconomy.com/countries/compare/norway/lithuania?sector=GDP+per+capita+%28Dollars%29&sc=XE34#tbl
According to data presented in Figure 2, Norway is roughly four times better developed economically.
Since we are going to be biased according to the described methodology, we start looking for the indicators, which are not favourable for Nordic countries, which Norway represents in our case.
Let us look at the corruption perception indicator, presented below in Figure 3.
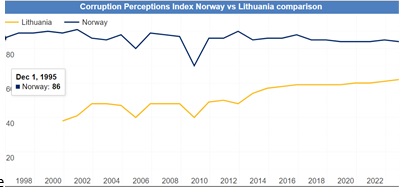
Figure 3. Corruption perception Index for selected countries
We see that the corruption perception Index is higher in Norway. Of course, the index may not have a relationship with the actual situation since it may be that Norwegian people are more vulnerable to signs of corruption.
Another indicator we select rather biasedly again is Doing Business Ranking, which, in principle, signals how bureaucratized business activities are. Data provided in Figure 4 signals that Norway is more regulated in terms of business development if compared to Lithuania.

Figure 4. Doing Business Indicator in considered countries
Several indicators biasedly selected show that countries' comparison requires more sophisticated methodologies. We achieved our simple task by selecting some indicators based on the statement that comparisons are not that simple and both countries have reasons for cooperation development.
Not to make an unintentional impression that Lithuania outperforms Norway in numerous ways, we state that there are no doubts about the economic strength of Norway. The trade balance 2022 in Norway was +28.36%, while in Lithuania, this indicator was 12.32% (https://countryeconomy.com). Here it is worth mentioning that Norway is polluting compared to Lithuania. Norway generated 7.70 CO2 Tons per capita in 2021, while Lithuania just 4.87 Tons per capita, respectively. Crude oil reserves and generation of GWh are more than 50 times bigger in Norway compared to Lithuania.
Forecasted economic growth in both countries
Let's use the above tool to look at the nearest forecasts in the countries under consideration.
The passport database, provided by Euromonitor International, suggests that in the case of ceteris paribus, in the year 2023, the third quarter, Lithuania will experience a slowdown in real GDP growth (-0.230 per cent), while Norway will continue growing (0.510 per cent) (Figure 5)

Figure 5. Change of real GDP in Lithuania and Norway, 2023, the third quarter
Source: Passpot, provided by Euromonitor International
As mentioned above in Figure 5, the screenshot provided from the Passport database reflects the forecast assuming that external conditions remain the same as they are now. On the right of the figure is a menu of global scenarios with their calculated probabilities. According to the source, the first scenario is "Global Stagflation" with 3 per cent probability. The Passport tool allows us to examine this scenario, and others too (such as “Global Bounce Back” with 15 per cent probability of occurrence, “Commodity Price Hike, having 10 per cent probability of happening, etc.). Seven scenarios with a diminishing probability of occurring are presented. An explanation of the detailed meaning of each scenario is provided in Passport. The tool allows one to select several scenarios and compare the consequences for GDP growth in a chosen country after one, two, and three years. An assumption is made that the implications of a downturn after a shock would be mitigated gradually.
Concluding remarks
The presented considerations can be generalized in the following insights:
1) Comparison of differently developed countries is a complicated task. There is a large set of indicators characterizing various facets of performance. Integrating those sets requires selecting a particular set of indicators and using a chosen methodology. Selection of hands can be biased, as in our case, and therefore can bring the reflection of reality, which is more desirable to the investigator;
2) Any research has to start with thorough characteristics of an object of the study. In our case, we aimed to compare selected countries; hence, the presentation of nations, understanding the path of their development, availability of resources and source of competitive advantage is crucial. Only then will we be able to capture the essence of economic interests leading towards cooperation and mutual benefits.
References
- Baltgailis, J. 2019. The issues of increasing the effectiveness of teaching comparative economics, Insights into Regional Development, 1(3), 190-199. https://doi.org/10.9770/ird.2019.1.3(1)
- Burinskas, A., Holmen, R. B., Tvaronavičienė, M., Šimelytė, A., Razminienė, K. (2021). FDI, technology & knowledge transfer from Nordic to Baltic countries, Insights into Regional Development, 3(3), 31-55.
- Country economy https://countryeconomy
- Kivi, L. H., Paas, T. (2021). T. Spatial interactions of employment in European labour markets. Eastern Journal of European Studies, 12, Special Issue, August 2021. EJES2021_12SI_KIV.pdf
- Lapinskienė, G., Podviezko, A. and Tvaronavičienė, M. (2023). The State of International TechnologyTransfer in The Northern Europe Region: Comparative Analysis by Modern Multiple Criteria Methods. Acta Montanistica Slovaca, 28(1), 69-82. https://doi.org/10.46544/AMS.v28i1.07
- Laurimäe, M., Paas, T., Paulus, A. (2022). The effect of COVID-19 and the wage compensation measure on income-related gender disparities. Baltic Journal of Economics, 2022, 22:2, 146-166.
- LIFT https://sisu.ut.ee/lift/bendra-informacija?lang=et
- Passport. Euromonitor International
- Sinitsyina A., Di Marino M., & Paas, T. (2022). Virtual Coworking and Remote Working: Corona Lessons and Perspectives from Estonia and Norway. In: I. Mariotti, M. Di Marino, & P. Bednar (Eds.). The COVID-19 pandemic and Future of Working Spaces. Routledge, in press.
- Šimelytė A., Tvaronavičienė M, Holmen R.B., Burinskas A., & Razminienė K. (2021). Knowledge and Technology Transfer as Driving Force for Social Innovations, Polish Journal of Management Studies, 23(2): 512-536.
- Tverdostup, M., Paas, T. (2022). Gender disparities in wage returns to human capital components: how different are European labour markets? Baltic Journal of Economics, 22 (1), 28−48.
- Tverdostup; M., Paas, T., Chebotareva, M. (2022). What Can Support Cross-Border Cooperation in the Blue Economy? Lessons from Blue Sector Performance Analysis in Estonia and Finland, Sustainability, 14(3),1817.
[1] Funding: The research is funded by Iceland, Liechtenstein and Norway through the EEA Grants. Project Title: The Economic Integration of the Nordic-Baltic Region Through Labour, Innovation, Investments and Trade (LIFT) Project contract with the Research Council of Lithuania (LMT) No is S-BMT-21-7 (LT08-2-LMT-K-01-070).